ANALYSIS Right off the bat, I’d like to state that the Tenang by-election result, including who voted for whom and at what percentage, is far less important than the property damage and hardship experienced by the voters in that constituency and in other parts of Johor as a result of the devastating floods.
Having said that, I still have the responsibility of analysing the by-election results. I had earlier predicted that the BN would win the by-election with a majority of 3,200, a 700-vote increase to the majority it got at the 2008 general elections.
The turnout assumption among the Malay, Chinese and Indian voters were 77%, 71% and 58% respectively and the support for the BN by ethnic group were 85%, 35% and 80%.
The eventual majority was 3,700 with the BN winning 70% of the popular vote on a lower than expected turnout of 67%.
One of the points of contention with regard to the election results has been whether or not the BN’s share of the Chinese vote has increased or decreased.
 The DAP has said that Pakatan Rakyat’s share of the Chinese vote has increased to 70% based on the results in the 96% Chinese-majority Bandar Labis Tengah polling station. MCA has said that the BN’s share of the Chinese vote has increased to 45% based on the fact that the BN won three out of the four Chinese-majority polling stations.
At the same time, there is broad agreement that the Malay and Indian vote did indeed swing back to the BN, which explains the 1,200 increase in BN’s winning majority.
Is the DAP or the MCA right? Does it even matter?
Analysing voting patterns by race
The question of racial voting patterns should be of interest to elections analysts. It is also what I do after every by-election to ascertain where I went wrong (and on occasions, where I went right).
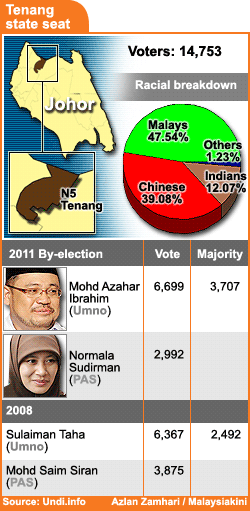 Estimating voting patterns by race is an inexact statistical exercise even under the best of circumstances. In the case of Tenang, I am hampered by a limited number of polling stations (only 12) which increases the variance of my estimates, especially for the Indian voters who comprise only 12% of the voting population, spread out over five polling stations.
This estimation exercise is a two-step process whereby I firstly estimate turnout by race and then use those turnout estimates to estimate voting by race.
Estimating turnout by race matters because significant differentials in the Malay, Chinese and Indian turnout rates will affect the effective ethnic composition of the constituency.
For example, in a constituency which is 50% Malay, 40% Chinese and 10% Indian, a turnout rate of 80%, 60% and 50% among the Malay, Chinese and Indian voters would change the ethnic composition of those who actually voted to 58% Malay, 35% Chinese and 7% Indian, which means that the Malay vote would count for ‘more’ than their share of the total electorate. (This would be significant especially in three Chinese-majority polling stations which were won by the BN)
The second stage of the estimation process, after obtaining turnout estimates by race, would be estimating voting by race. The estimation procedure I use was developed by Harvard statistician and political scientist Gary King. It uses the turnout, voting and ethnic composition of each polling station, weighted by the number of voters from each ethnic group to arrive at turnout and voting by race estimates.
 For example, the three Felda polling stations - which are over 95% Malay and which also has the largest number of Malay voters - registered an average turnout rate of 80% and an average BN support rate of 84%. The figures would factor heavily in the estimation procedures calculation of Malay turnout and voting rates.
Similarly, the 56% turnout and 30% BN support rate in the 96% Chinese-majority Bandar Labis Tengah, which is also the polling station with the largest number of Chinese voters, would factor heavily in the estimation of Chinese turnout and voting rates.
Using this procedure, I estimate the Malay and Chinese turnout rates to be 79% and 55% respectively and their BN support rates at 86% and 32% respectively.
This means that the BN support among the Malays increased, as anticipated, and at the same time, the BN support among the Chinese, decreased which gives some statistical evidence to support DAP’s argument. (Of course, Chinese support for PAS was 68% rather than the 70% initial estimate given by the DAP).
The Indian turnout and voting rates are the most difficult to estimate given that they make up the smallest percentage of voters in this constituency, which means that my estimates of a 50% Indian turnout and 86% BN Indian support has the highest variance.
About 32% Chinese backed BN
Do these numbers make sense? How does it square with the fact that the BN won the majority of votes in three out of four Chinese-majority polling stations?
Let’s take the polling station of Bandar Labis Timur, a 63% Chinese, 26% Malay and 11% Indian polling station with a turnout rate of 62% and where 52.6% of voters voted for the BN (a 66-vote majority for the BN in 2011 as compared to a 71-vote majority for the opposition in 2008).
 Adjusting for differential turnout rates among the different ethnic groups, the effective ethnic composition of those who actually voted in this polling station is 58% Chinese, 33% Malay and 8% Indian (the effective percentage of Malays increase because of the higher Malay turnout rates).
A Malay, Chinese and Indian BN support rate of 86%, 32% and 85% respectively would give us an overall BN support rate of 54.6%, not far from the actual 52.6%.
As it turn outs, the estimation procedure allows us to calculate point estimates of racial voting by polling station – 85% Malay, 29% Chinese, 86% Indian, in this case. We can do the same for the other two Chinese-majority polling stations – Labis and Tenang Station – and only in Tenang station do we find Chinese support for the BN to be higher at approximately 49%.
But because the number of Chinese voters in the Labis town centre (Bandar Labis Timur, Bandar Labis Tengah and Labis) outnumber the number of Chinese voters in Tenang Station by almost four to one, BN’s better performance in Tenang Station was only sufficient to pull the level of BN support among the Chinese to approximately 32%.
 Of course, one could say that my estimates of the Chinese vote in Bandar Labis Timor and Labis overestimate the level of BN support among the Malays and Indian, therefore underestimate the level of BN support among the Chinese.
But if this is the case, one has to give a sound reason as to why these polling stations, which are located more or less in the same area as Bandar Labis Tengah, would exhibit significantly different voting patterns among not just the Chinese voters, but also the Malay and the Indian voters as well.
For the sake of argument, let’s say that my estimates could be wrong. But how far wrong can they be? Would they be so far off that the estimated Chinese support for the BN is actually closer to the 45% level which the MCA claims ( according to reports in The Star ).
For the MCA to support this claim that it won 45% of the Chinese vote, this must mean that it won approximately 55% of the Chinese vote in the three other Chinese-majority polling stations besides Bandar Labis Tengah. Does this claim seem likely or even possible? Let’s go back to Bandar Labis Timur, where the BN won 52.6% of the popular vote.
If the BN won 55% of the Chinese vote in this polling station, this means that the Malay and Indian support for the BN in this same polling station would be approximately 50%, which is at least 30% below what level of Malay and Indian support in the other polling stations.
 One would have to ask what was it which MCA did which was not only effective in winning 55% of the Chinese vote in Bandar Labis Timur but also in alienating the Malay and Indian vote to the point that they abandoned the BN in droves in this polling station? The same question would also have to be asked in the polling stations of Labis and to a lesser extent Tenang Station.
With these numbers to back me up, I’m positive that the BN support among the Chinese voters was less than 40%. There is a possibility that the BN may have increased their share of Chinese vote from the 35% it obtained in 2008 to perhaps 38% or 39%.
This is within the margin of error. But to say that the BN managed to obtain 45% of the Chinese vote is a stretch of the imagination, to say the least, as well as a stretch to my limited Math ability. (I’ve made this offer before and I’ll make it again. If MCA chief Chua Soi Lek wants me to explain this to him in person, all he has to do is to buy me a ‘teh tarik’).
Low turnout makes little difference
One more quick note: If the Chinese and Indian turnout were 71% and 58% respectively instead of 55% and 50% respectively, the BN majority would have decreased by approximately 213 votes (assuming that the Chinese and Indian levels of BN support among those additional voters were also 32% and 86% respectively) which would have resulted in a BN majority of approximately 3,500 votes.
This is of course, not to miss the forest for the trees. The fact remains that the BN managed to increase its majority by 1,200 votes. The fact remains that the by-elections in 2010 as well as the Tenang by-election show a national pattern of the Malay as well as the Indian vote returning to the BN. Pakatan Rakyat should be concerned about these trends and needs to be pro-active in trying to reverse this trend.
Continuing to harp on the Chinese vote and to put pressure on the beleaguered MCA president may be necessary to prevent MCA from re-gaining any political momentum among Chinese voters but it does very little to put Pakatan on track to win the next general election.
ONG KIAN MING holds a PhD in Political Science from Duke University. He is currently a lecturer at UCSI University. He can be reached at im.ok.man@gmail.com.


